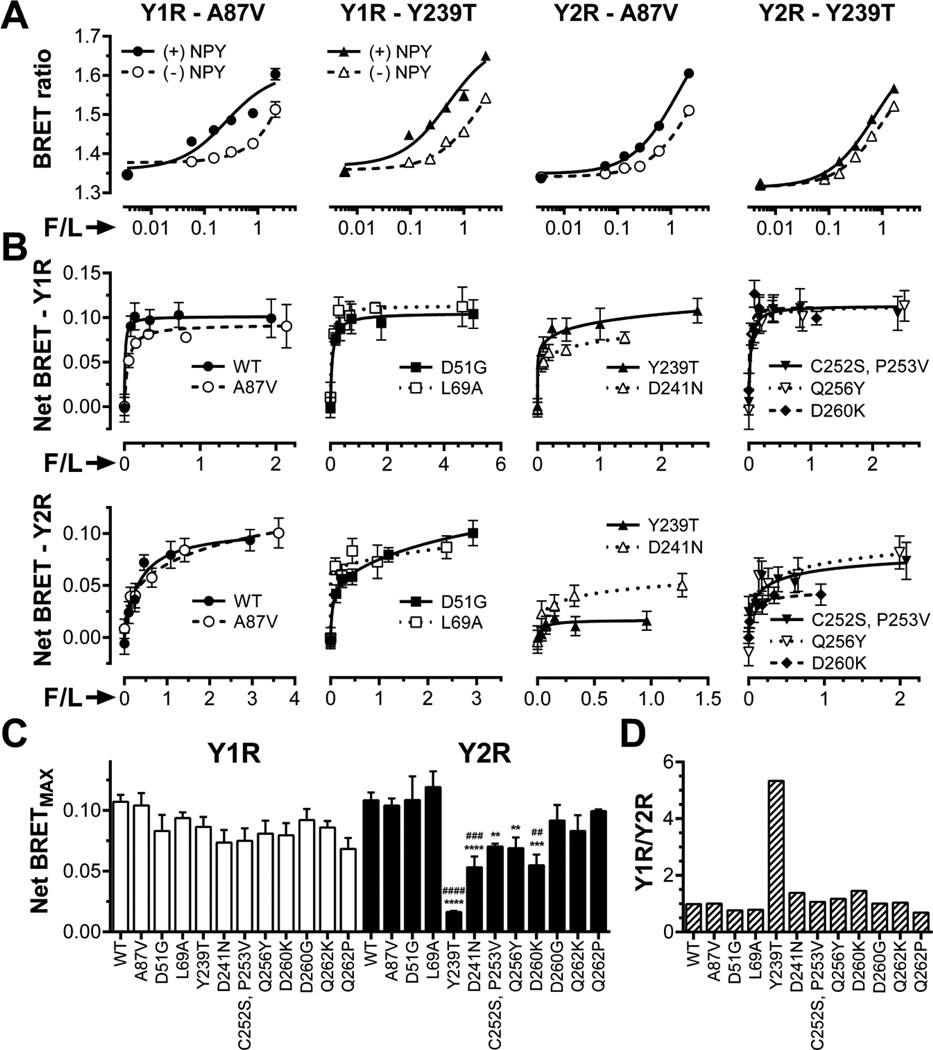
Fig. 5. Mutations in arr-3 differentially affect its binding to Y1R and Y2R.
A. BRET ratio as a function of Venus-arrestin fluorescence normalized by receptor-RLuc luminescence (F/L) in the presence of agonist (filled symbols; solid lines) or vehicle (open symbols; dashed lines) for the base mutant Ala87Val (A87V, circles), Ala87V-Tyr239Thr (Y239T, triangles). B. Net BRET (agonist-induced increase in BRET signal) vs F/L. Means ± SEM of six repeats in a representative experiment (out of 3–15 performed) for indicated forms arr-3 and receptors are shown. C. Net BRETMAX for the indicated mutant-receptor combinations determined by a fit of the data shown in B to one-site binding hyperbola using GraphPad Prism 6.03. Mean BRETMAX ± SEM is shown (n=3–15). D. Ratio of Y1R/Y2R binding of indicated arr-3 mutants (the ratio for arr-3-Ala87Val base mutant was set at 1). Statistical significance was determined using one-way ANOVA followed by Dunnett's multiple comparison test. **, p < 0.01; ***, p < 0.001; ****, p<0.0001 as compared to WT arr-3. ##, p < 0.01; ###, p < 0.001; ####, p < 0.001; as compared to the Ala87Val mutant.

