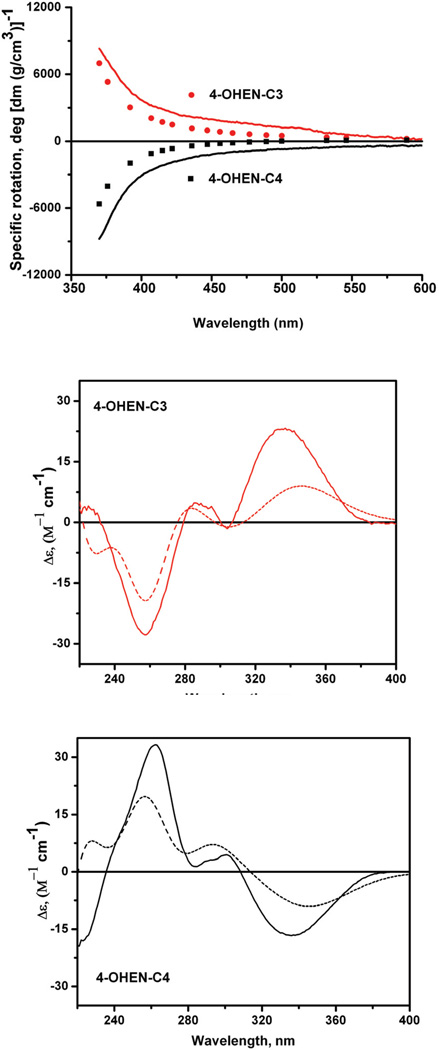
Figure 5.
Top panel: Comparisons of computed 4-OHEN-C3 and -C4 adduct ORD spectra (circles) and experimentally measured ORD spectra (solid lines) of C3 and C4 adducts (see the text). Middle and bottom panels: Computed 4-OHEN-C3 and -C4 adduct ECD spectra (dashed lines), and comparisons with experimentally measured ECD spectra (solid lines) of C3 and C4 adducts (see the text).

