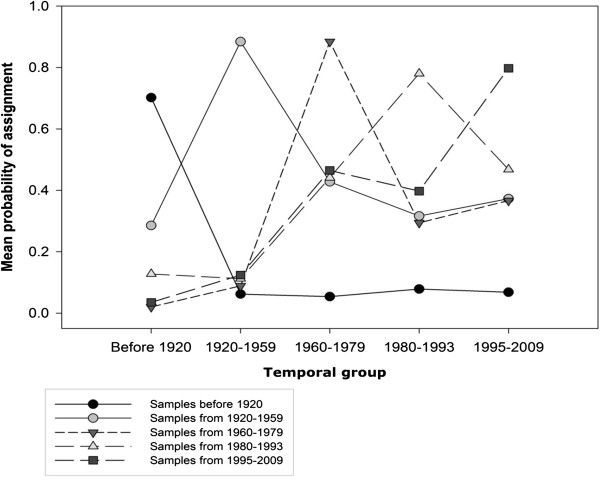
Figure 7.

FCA plot for the historical temporal groups together with wolf samples collected after the population recovery (N = 298 from 1995–2009; [20]). The approximate distribution of oldest (collected before 1920) and modern-day groups are shown with ovals. Arrows show the northern wolves forming a distinctive cluster in Structure analysis.
