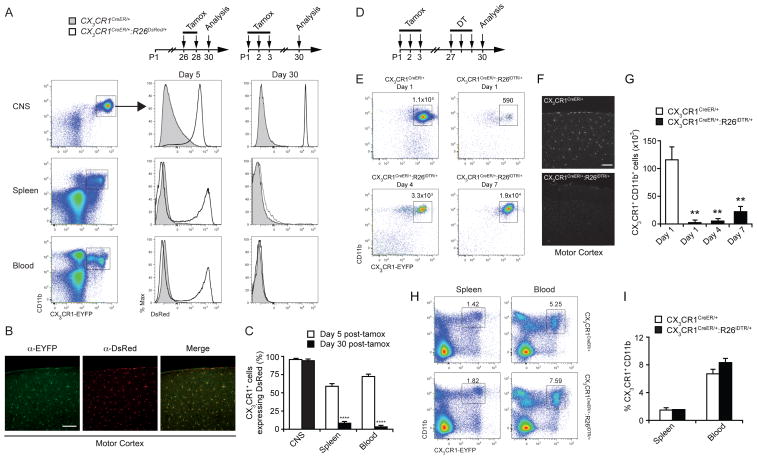
Figure 2. A strategy to restrict Cre-mediated manipulation of gene function including deletion of microglia.
(A) CX3CR1-EYFP+ CD11b+ populations in various tissues from mice of the indicated genotypes 5 or 30 days post-tamoxifen treatment. (B) Coronal sections of motor cortex from CX3CR1CreER/+:R26DsRed/+ mice stained for EYFP and DsRed 30 days after tamoxifen treatment. (C) Quantification of flow cytometry fluorescence-activated cell sorting (FACS)analysis showing the percentage of CX3CR1-EYFP+ cells co-expressing DsRed in multiple tissues at 5 or 30 days post-tamoxifen treatment. (D) Time-course of tamoxifen/DT administration and analysis. (E) FACS analysis of microglia in the brain of control and microglia-depleted mice at indicated time points after DT administration. Dot plots show total number of CX3CR1-EYFP+ CD11b+ cells gated on DAPI− CD3− CD19− CD45int. (F) Coronal sections of motor cortex from control or microglia-depleted mice stained for Iba1 one day after DT administration. (G) Number of CX3CR1-EYFP+ CD11b+ microglia in the brain after DT administration at various time-points. (H) FACS analysis showing percentage of CX3CR1-EYFP+ CD11b+ cells in the spleen and blood of mice after DT administration. (I) Quantification of data shown in (H). n=4 animals for each experimental condition. Data are represented as mean +/− SEM. ****p<0.0001, *p<0.05; Scale bar= 100 μm. See also Figures S1, S2, S3.

