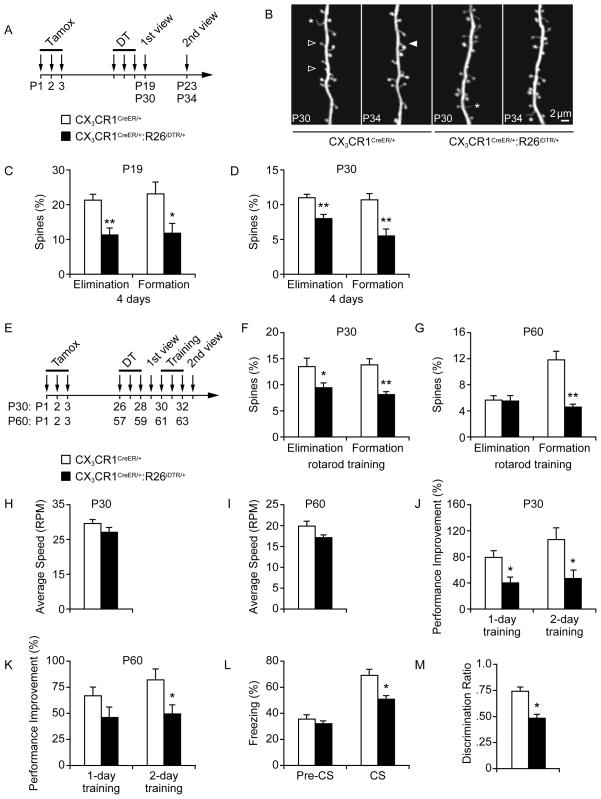
Figure 3. Microglia are important for learning-dependent spine remodeling and performance improvement.
(A) Timeline of tamoxifen/DT administration and in vivo imaging in CX3CR1-iDTR mice. (B) Transcranial two-photon imaging of dendritic spines in control and microglia-depleted mice. Filled and empty arrowheads indicate spines formed or eliminated between two views. Asterisk indicates filopodia. (C–D) Percentage of spines formed or eliminated within 4 days in the motor cortex was significantly reduced after microglia depletion in both P19 (C) and P30 animals (*p<0.05, **p<0.01, n=4–6). (E) Timeline of tamoxifen/DT administration, rotarod training, and in vivo imaging. (F) Motor learning-related spine remodeling was significantly reduced in P30 mice with microglia depletion (*p<0.05, **p<0.01, n=4–5). (G) Motor learning-related spine formation was significantly reduced in P60 mice with microglia depletion (**p<0.01, n=4–5). (H) Average speed reached during the first rotarod training session in P30 mice (n=6–7). (I) Average speed reached during the first rotarod training session in P60 mice (n=8). (J) Microglia-depleted mice showed impaired performance improvement compared to non-depleted control mice over one or two days of training (*p<0.05, n=6–7). (K) P60 microglia-depleted mice showed impaired performance improvement compared to non-depleted control mice over one or two days of training (*p<0.05, n=8). (L) Percentage of freezing in control or microglia-depleted mice before (pre-CS) and during (CS) presentation of the conditioned stimulus in the recall test (*p<0.05, n=8) (M) Discrimination ratio of time spent interacting with a novel object vs. a familiar object in a novel object recognition assay was significantly altered in microglia-depleted mice (*p<0.05, n=8). Data are represented as mean +/− SEM. See also Figure S4.

