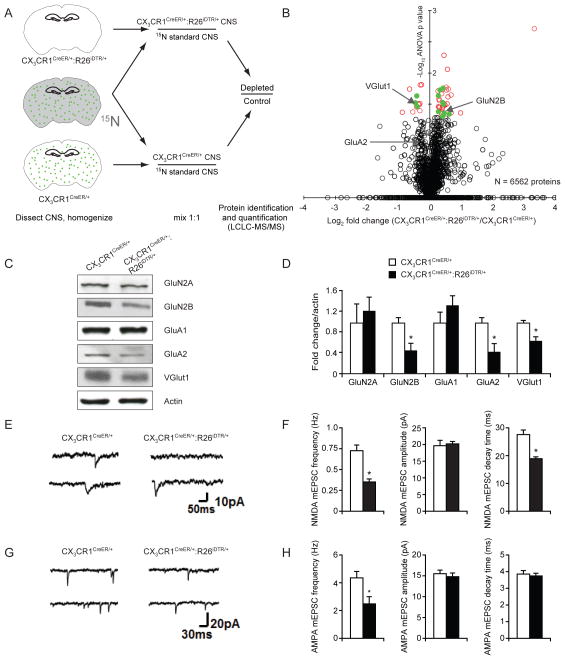
Figure 4. Biochemical and electrophysiological properties of synapses are altered in microglia-depleted brains.
(A) Quantitative proteomic scheme to identify CNS proteins altered after microglial depletion. Control (n=3) or microglia-depleted (n=3) brain homogenates were mixed 1:1 with 15N internal standard and were prepared together. Samples were then analyzed by LCLC-MS/MS shotgun proteomics. Green dots represent microglia. (B) Proteomic summary volcano plot (x-axis=log2 CX3CR1CreER/+/CX3CR1CreER/+:R26iDTR/+, y-axis=−log10 ANOVA p value). Black open circles: quantified proteins, red open circles: significantly altered proteins, green filled circles: significantly altered proteins with known synaptic functions. (C) Synaptosome fractions from control or microglia-depleted brains probed with indicated antibodies by Western blot. (D) Densitometric quantification of Western blots in (C) (*p<0.05, n=6). (E) Examples of NMDA mEPSCs in layer V pyramidal neurons from control and microglia-depleted mice. (F) Average NMDA mEPSC frequency, amplitude and decay time in control (n=17 cells) and microglia-depleted mice (n=17 cells). mEPSC frequency and decay time were significantly reduced in microglia-depleted mice (p<0.001). (G) Examples of AMPA mEPSCs in layer V pyramidal neurons from control and microglia-depleted mice. (H) Average mEPSC frequency, amplitude and decay time in control (n=9 cells) and microglia-depleted mice (n=8 cells). mEPSC frequency was significantly reduced in microglia depleted mice (p<0.05). Data are represented as mean +/− SEM. See also Table S1.

