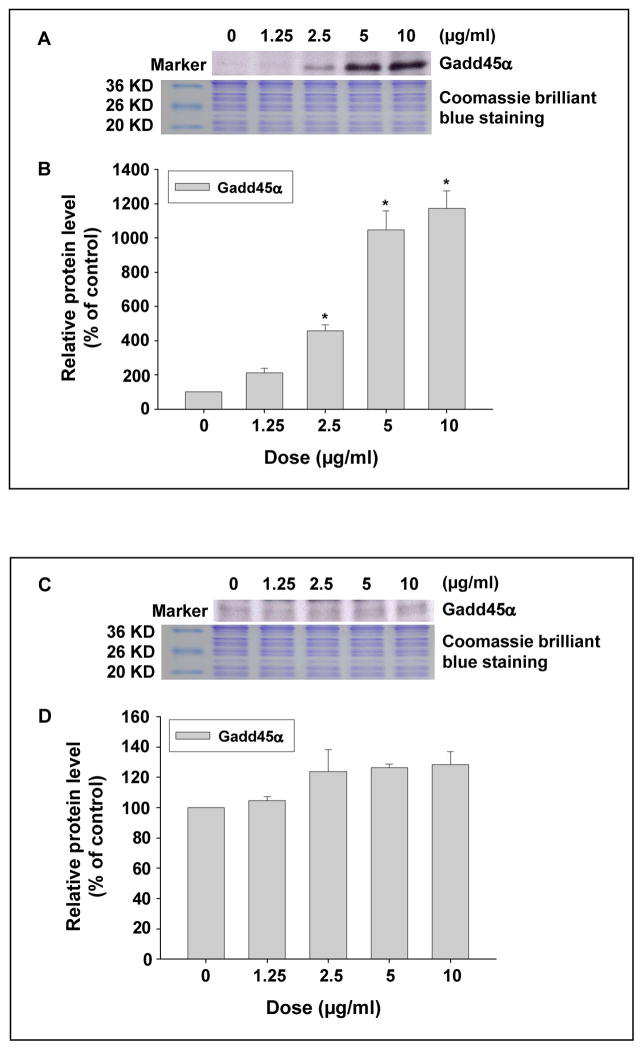
Fig. 5 (A–D). Dose-response induction of Gadd45α protein expression in HIF-1α (+/+) cells (A and B) exposed to Nano-Co, but not in HIF-1α (−/−) cells (C and D).
Cells were treated with 1.25, 2.5, 5, and 10 μg/ml of Nano-Co for 6 h. Cells without particle treatment were used as the control. Gadd45α protein level was measured by Western blot. (A and C) show the results of a single Western blot experiment. (B and D) represent normalized band densitometry readings averaged from three independent experiments ± SD of Western results. * Significant difference as compared with the control, p<0.05.

