
Figure 2.
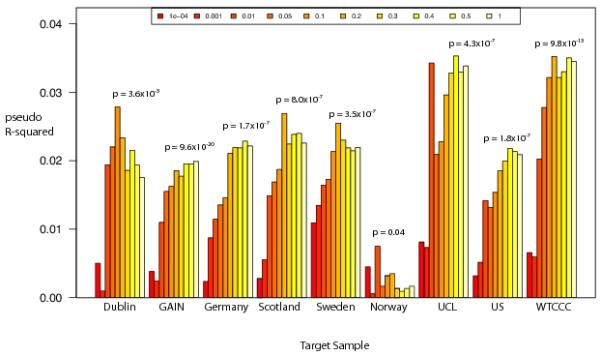
Average pseudo R2 values for polygenic prediction of BP vs SCZ phenotype into the target sample where all other samples were used for discovery.
Official websites use .gov
A
.gov website belongs to an official
government organization in the United States.
Secure .gov websites use HTTPS
A lock (
) or https:// means you've safely
connected to the .gov website. Share sensitive
information only on official, secure websites.
Average pseudo R2 values for polygenic prediction of BP vs SCZ phenotype into the target sample where all other samples were used for discovery.