
Figure 3.
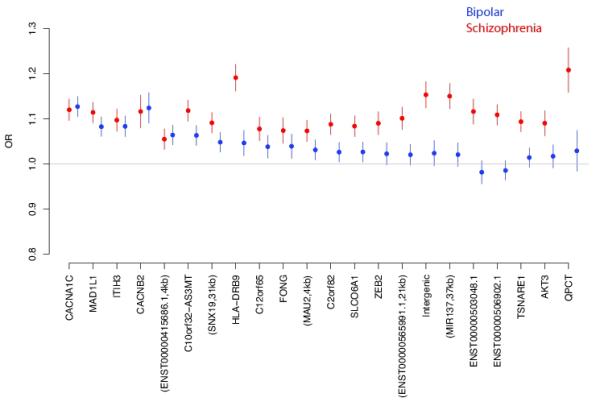
Comparison of odds ratios from independent samples of BP (blue) and SCZ (red) for genome-wide significant loci previously identified in SCZ.
Official websites use .gov
A
.gov website belongs to an official
government organization in the United States.
Secure .gov websites use HTTPS
A lock (
) or https:// means you've safely
connected to the .gov website. Share sensitive
information only on official, secure websites.
Comparison of odds ratios from independent samples of BP (blue) and SCZ (red) for genome-wide significant loci previously identified in SCZ.