
Figure 4.
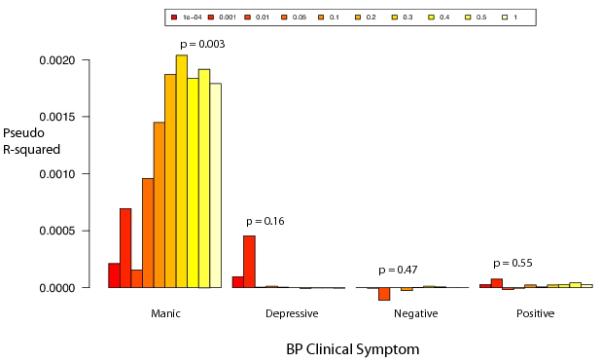
Average pseudo R2 values for predicting SCZ vs controls utilizing odds ratios estimated from BP vs controls GWAS. There are 10 R2 values for each factor score representing 10 different p-value cutoffs for SNPs included in making the risk score (P < 0.0001, P < 0.001, P < 0.01, P < 0.05, P < 0.1, P < 0.2, P < 0.3, P < 0.4, P < 0.5, P < 1).