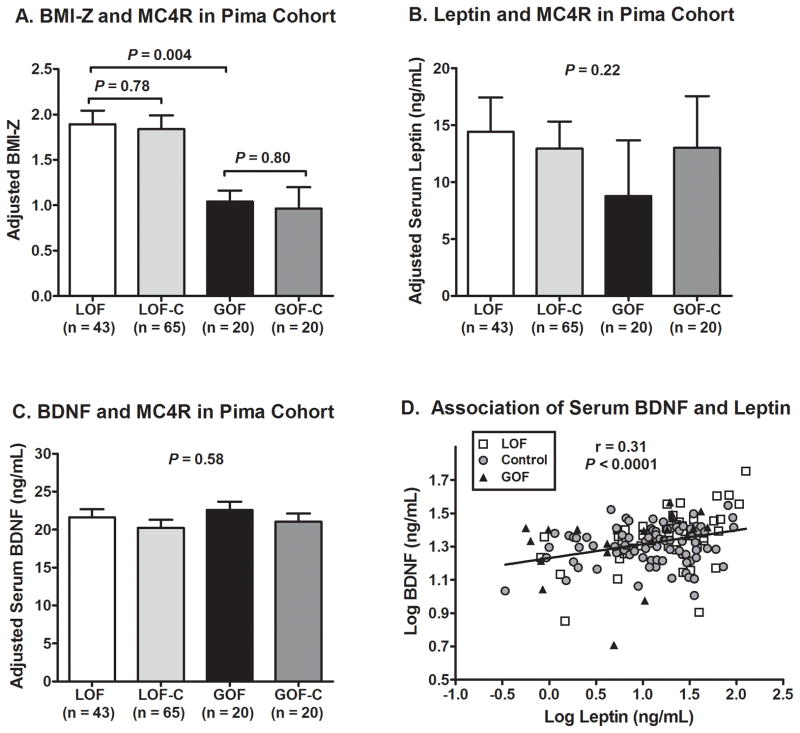
Figure 1.
Comparison of subjects in the Pima cohort by MC4R functional status. (A) BMI-Z (adjusted for age, sex, and percent Indian heritage) was similar for LOF vs. LOF-C and for GOF vs. GOF-C. The LOF and LOF-C groups had higher adjusted BMI-Z than the GOF and GOF-C groups. Adjusted means ± SEMs and P values from post-hoc least significant difference (LSD) pairwise comparisons are shown. (B) Serum leptin concentration (adjusted for age, sex, BMI-Z, percent Indian heritage, and sample storage time) was not significantly different between groups. (C) Serum BDNF concentration (adjusted for age, sex, BMI-Z, percent Indian heritage, and sample storage time) was not significantly different between groups. (D) Serum BDNF and leptin concentrations were positively correlated, but there was no significant difference in this relationship by MC4R functional status (P = 0.08). For (B)–(D), log values were used for calculations. For (B)–(C), back-transformed adjusted means ± 95% CIs and overall P value from ANCOVAs are shown.

