Figure 6.
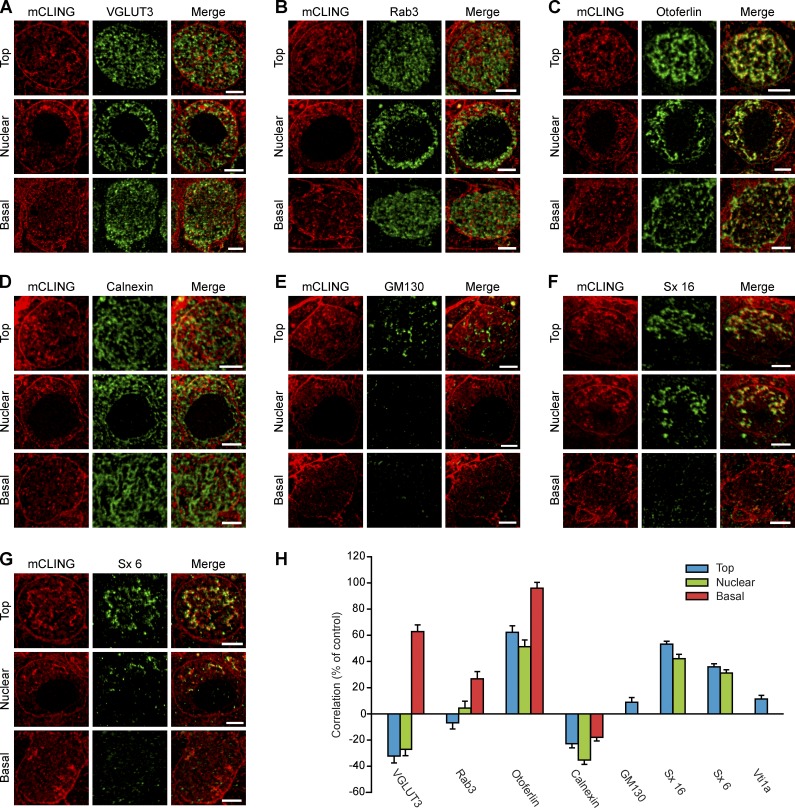
Immunostaining analysis of the organelles involved in membrane recycling in IHCs. We labeled organs of Corti with mCLING and then immunostained them for different organelle markers. (A–G) The following markers were analyzed using two-color STED: VGLUT3, a synaptic vesicle marker (A); Rab3, a second synaptic vesicle marker (B); the synaptic protein otoferlin (C); the ER marker calnexin (D); the cis-Golgi apparatus marker GM130 (E); and the SNARE proteins syntaxin 16 (Sx 16) and syntaxin 6 (Sx 6), markers for endosomes (F and G). (H) Pearson’s correlation coefficients were determined for each immunostaining condition. For the markers present throughout the cell, the correlation coefficients were calculated at all the different levels of the cell (top, nuclear, and basal). For markers abundant only at the top (or the top/nuclear) level, the analysis was not performed at other levels. The correlation with an additional endosomal marker, the SNARE Vti1a, is also shown. Coefficients are expressed as percentages of the maximum expected correlation (% of control) obtained from two-color immunostaining of VGLUT3 using Atto647N- and Chromeo494-coupled secondary antibodies. Error bars represent mean correlation coefficient ± SEM (from 100 to 500 mCLING-labeled organelles, from 20 to 85 cells, in two to six independent experiments for each marker protein). Bars, 2 µm.

