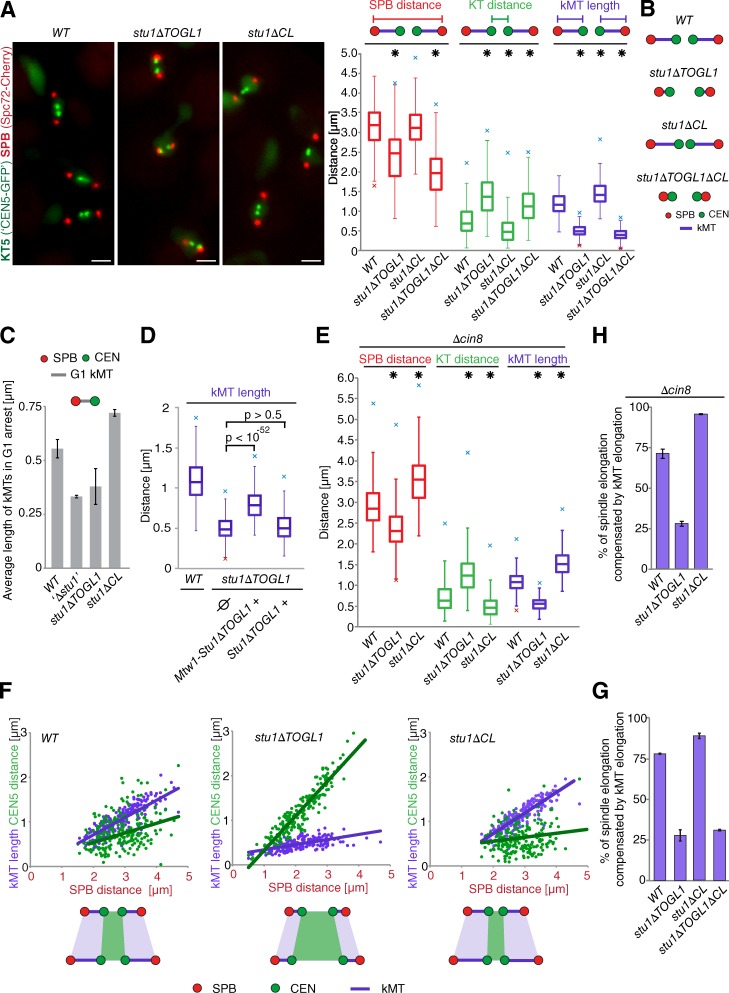
Figure 5.
Stu1 at metaphase KTs allows adaption of kMT length in correlation to tension at the KT–MT interface. (A–C) The kMT length is decreased in TOGL1 and increased in CL deletion mutants. (A) Cells were arrested in metaphase by Cdc20 depletion for 5 h. Bars, 2 µm. n > 200. Asterisks indicate significant differences to WT with P < 0.0001. (B) Schemes illustrating the results described in A. (C) Cells were arrested in G1 for 3 h. n > 100. Error bars represent the SDs for two experiments. (D) KT-linked Stu1ΔTOGL1 partially rescues kMT lengths in metaphase. stu1ΔTOGL1 cells additionally expressing either an Mtw1-Stu1ΔTOGL1 fusion protein or Stu1ΔTOGL1 were analyzed as in A. n > 100. Ø indicates that no additional Stu1 construct was expressed. (E) CIN8 deletion intensifies the ΔCL but fails to rescue the ΔTOGL1 phenotype. Cells with a Δcin8 background were analyzed as in A. n > 100. Asterisks indicate significant differences to WT with P < 0.0001. (A, D, and E) Boxes cover the middle 50% of the data, with a horizontal line at the median. Whiskers show the range of data (maximal 1.5× interquartile range). Maximal outliers are shown as crosses. (F) Cells were arrested in metaphase by Cdc20 depletion. (F and G) The percentage of spindle elongation that is compensated by kMT elongation is strongly decreased in the absence of TOGL1 but increased in the absence of CL in comparison with WT cells. After 2 and 5 h, inter-KT distances and kMT lengths of individual cells were determined and blotted against the corresponding inter-SPB distance. The models illustrate how kMTs and inter-KT distances react to spindle elongation as revealed by the presented data. n > 100. Lines indicate the linear regression. (G) Percentage of spindle elongation that is compensated by kMT elongation. The values represent the twofold slopes of the kMT graphs (purple) as shown in F. Error bars represent the SDs for two experiments. (H) Δcin8 strains with the indicated Stu1 constructs were analyzed as described in F and G. n > 100. Error bars represent the SDs for two experiments.

