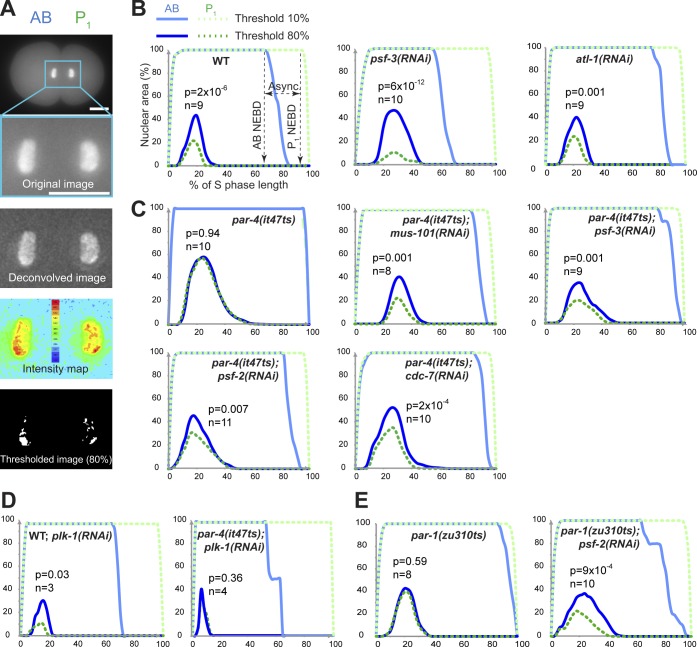
Figure 3.
PAR-4 and PAR-1 asymmetrically regulate the initiation of DNA replication at the two-cell stage. (A) Fluorescence images of a C. elegans embryo transgenically expressing GFP::PCN-1 before (top image) and after a series of transformations that include deconvolution (second from top image), intensity measurements (second from bottom image), and threshold application (bottom image). GFP::PCN-1 nuclear distribution was measured from images after thresholds had been applied. Bars, 10 µm. (B–E) Mean percentages of AB or P1 nuclear regions occupied by GFP::PCN-1 foci after applying 10 or 80% fluorescence threshold over time during two-cell stage embryonic development. For each specified condition, analyses were made using wild-type embryos at 25°C (B), par-4(it47ts) embryos at 18°C (C and D), or par-1(zu310ts) embryos at 22°C (E). In all conditions, time is expressed in percentage of S-phase length to allow a better comparison between different embryos. For each graph, the p-value (Student’s t test) highlights the statistical difference in fluorescence distribution at the point of maximal enrichment between AB and P1 at 80% fluorescence threshold, and n corresponds to the number of embryos analyzed. WT, wild type.

