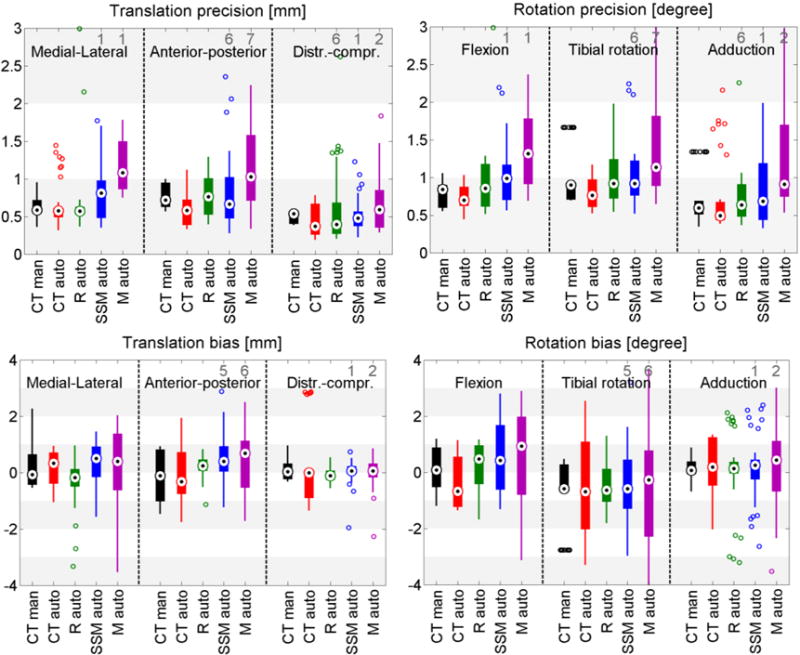
Figure 4.

Box plots of the kinematic precision (1st row) and bias (2nd row) with all methods on the cadaveric datasets. Results are relative to the gold standard marker based kinematics. The black dots represent the median value, wide lines indicate the 25th and 75th percentiles, and whiskers extend to the most extreme data points not considered outliers. Outliers are plotted individually as circles, and the number of outliers outside the axis range is shown in gray numbers.
