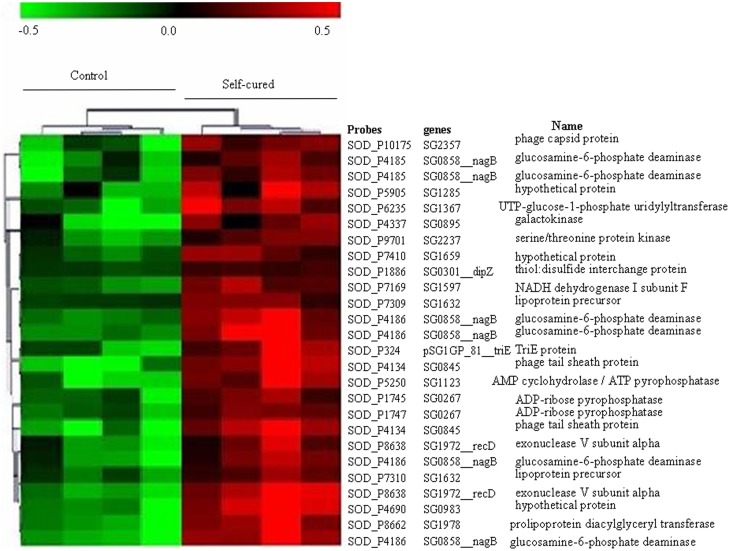
Figure 1.
Expression profile of Sodalis glossinidius genes whose transcript levels changed significantly between trypanosome self-cured flies and control flies fed on a non-infected blood meal. This set of genes was extracted from the full data set (n = 2823) using a SAM procedure with a 5% false discovery rate. Each row represents a gene and each column represents a sample. Red and green indicate expression levels above and below the median, respectively. Dendrogram of genes, to the left of the matrix represents overall similarities in gene expression profiles.

