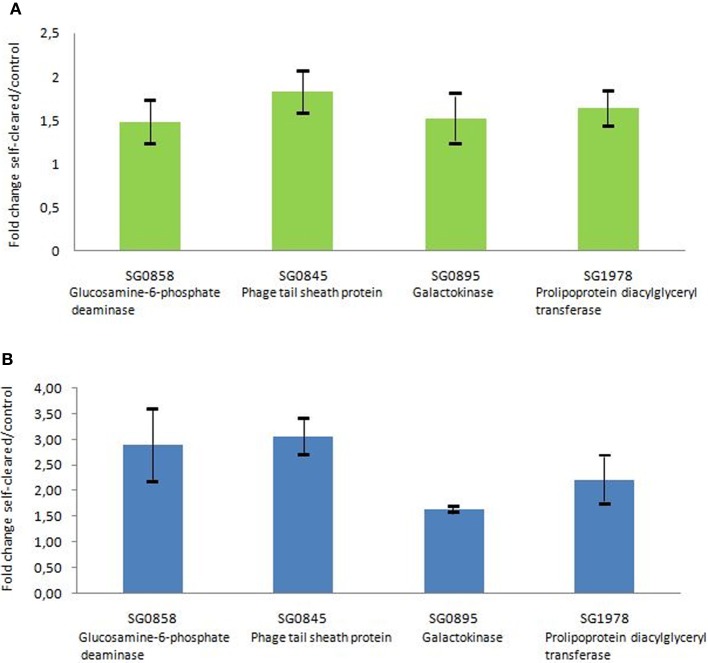
Figure 2.
Comparison of selected gene expression assessed by quantitative PCR and by microarray technologies. (A) Gene expression was assessed by microarray technology. The n-fold change value was calculated on the basis of normalized data when comparing the level of gene expression from S. glossinidius derived from self-cured flies with those of control flies fed on a non-infected blood meal. Error bar represents the standard deviation (SD) between biological replicates. (B) Gene expression was assessed by quantitative PCR. Data were analyzed with the 2−ΔΔC(t) method with Glossina tubulin gene as a control gene. The n-fold change value represents the mean of the Sodalis gene expression level in self-cured flies compared with control. Error bar represents the SD between biological replicates.

