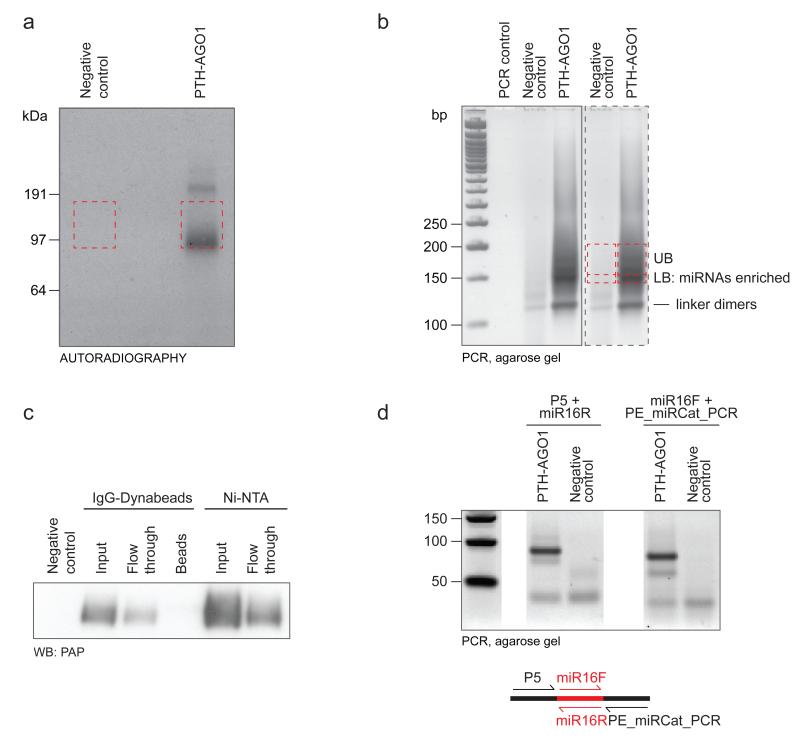
Figure 3.
Examples of gel analyses at different steps in the CLASH protocol. a: SDS-PAGE purification of the AGO1 protein, visualized by autoradiography of the radioactively labelled, crosslinked RNA (Step 55). Red dashed lines indicate the regions excised for elution of the RNA-protein complexes. b: MetaPhor agarose separation of the PCR amplified DNA library ready for sequencing (Step 76). Gel in the dashed box is a fragment of the original scan (solid box) repeated for clarity of the picture. Red dashed lines indicate the regions excised for preferential recovery of miRNAs (LB) and chimeric cDNAs/targets (UB). c: Recovery of the tagged AGO1 on IgG-Dynabeads and Ni-NTA resin (Step 25); western blot with peroxidase-anti-peroxidase (WB: PAP) soluble complex antibody recognizing Protein A tag; beads: residual AGO1 after elution; eluate fraction from IgGDynabeads is coinciding with Ni-NTA input d: MetaPhor agarose separation of the control RT-PCR products generated with miR-16 specific primers.

