
Figure 5.
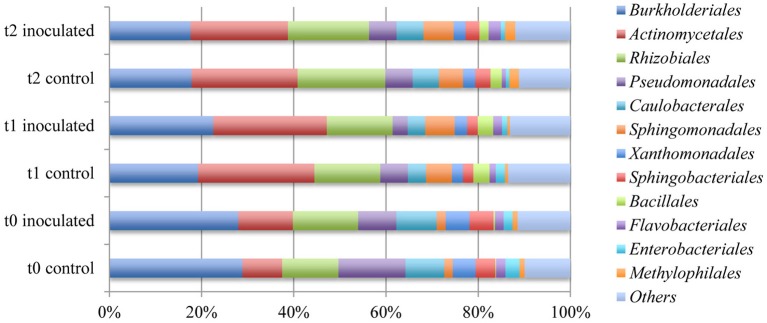
Comparison of the ten most abundant orders within the rhizosphere of lettuce. Abundances were calculated by means of comparison of metagenome sequence reads against the GenBank database within the MG-RAST software package.
Official websites use .gov
A
.gov website belongs to an official
government organization in the United States.
Secure .gov websites use HTTPS
A lock (
) or https:// means you've safely
connected to the .gov website. Share sensitive
information only on official, secure websites.
Comparison of the ten most abundant orders within the rhizosphere of lettuce. Abundances were calculated by means of comparison of metagenome sequence reads against the GenBank database within the MG-RAST software package.