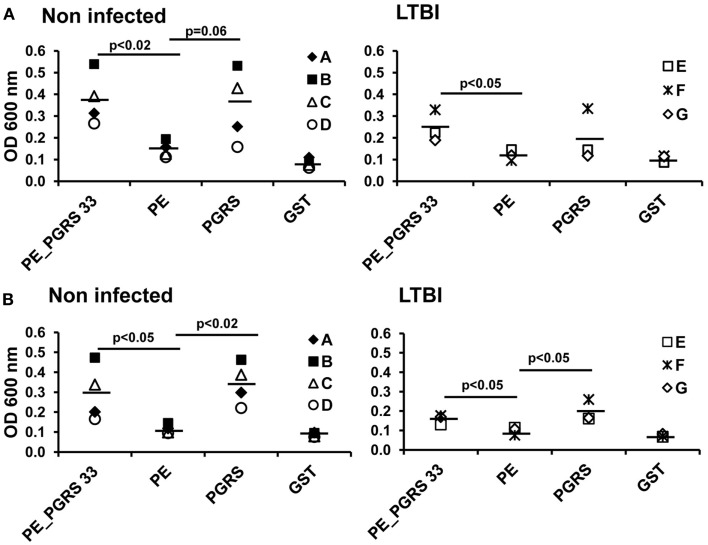
Figure 5.
Antigen-specific antibody response in LTBI and non-infected individuals. Sera from LTBI and non-infected vaccinated individuals were diluted 1:300 and incubated with PE_PGRS33, PE, PGRS, and the control protein GST. Antigen-specific IgG (A) and IgG1 (B) were evaluated by ELISA. Letters in legend represent each individual tested and symbols correspond to OD readings. Mean values are showed as horizontal bars.

