Figure 2.

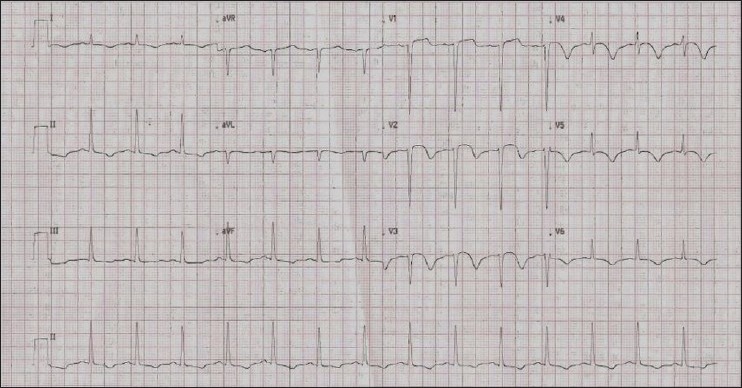
ECG on day 8, when the patient developed sudden hypotension, showing Q waves with ST elevation in V1-V3, T inversions in all other leads suggesting anterior wall ST elevation MI

ECG on day 8, when the patient developed sudden hypotension, showing Q waves with ST elevation in V1-V3, T inversions in all other leads suggesting anterior wall ST elevation MI