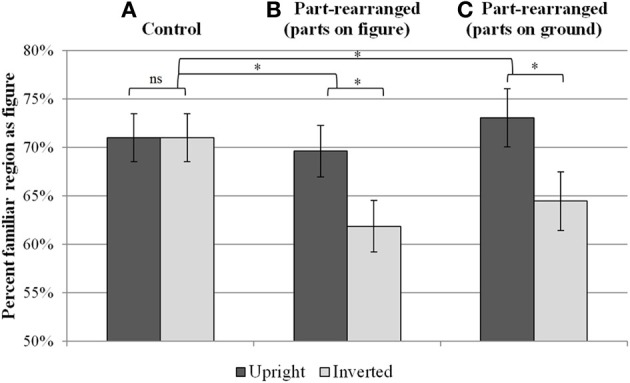
Figure 4.

Mean percent of trials on which the familiar region was reported as the figure for each of the between-subjects conditions. Results of Experiment 1 are shown in (A) for the control condition and (B) for the part-rearranged condition in which the familiar parts were depicted on the figure side of the prime's borders. Results of Experiment 2 are shown in (C) for the part-rearranged condition in which the familiar parts were suggested in on the groundside of the prime's borders. Error bars represent standard error of the mean of the difference scores (upright-inverted). *p < 0.05.
