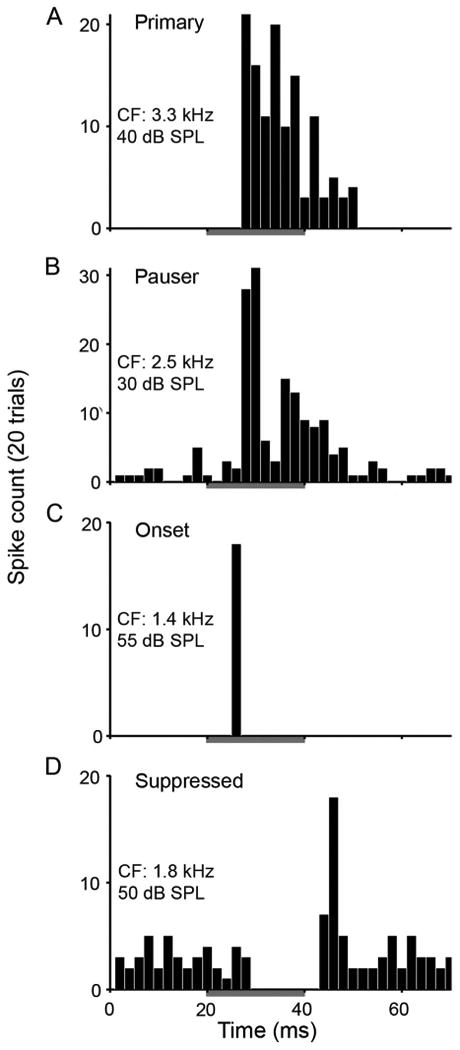
Figure 1.

SON neurons show three classes of response patterns to ipsilateral tones. Post-stimulus time histograms constructed from responses to 20 presentations of CF tones at 20 dB above response threshold. See histograms for CF of neurons and stimulus intensity. A–D: Histograms show sustained (including primary-like [A] and pauser-like [B] types), onset (C), and suppressed (D) firing patterns. Gray bars indicate 20-ms tone presentations with 5-ms rise and fall times for triangle-shaped envelopes. Binwidth: 2 ms.
