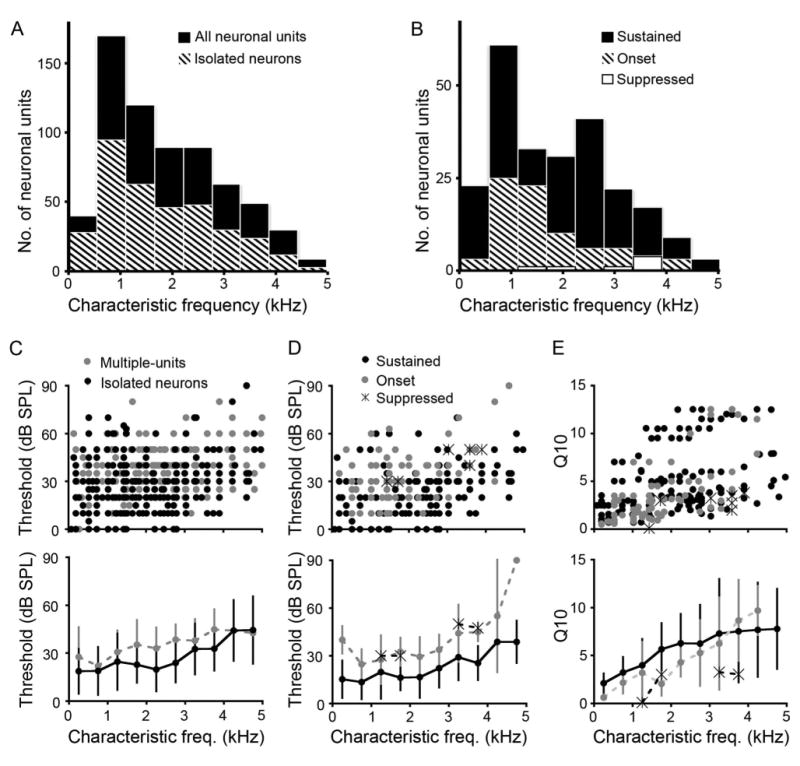
Figure 3.

Heterogeneity of response properties to ipsilateral tones is expressed across CF in SON. A: Histogram of CFs for all neuronal responses (black) (mean ± SD, CF: 1,947 ± 1,198 Hz, n = 659) and isolated neuronal responses (striped; 1,834 ± 1,170 Hz, n = 349). B: Histogram of CFs for sustained (black; 1,870 ± 1,214 Hz, n = 233), onset (striped; 1,690 ± 1,031 Hz, n = 80), and suppressed (white; 2,975 ± 994 Hz, n = 7) isolated neuronal responses (binwidth: 600 Hz). C: Scatterplot showing response threshold as a function of CF for each recording site (top panel) and mean thresholds shown below for both multiple units (gray) and isolated neurons (black; multiple-unit threshold: 34 ± 15 dB, n = 310; isolated neurons: 24 ± 16 dB). D: Top panel, scatterplot showing distribution of thresholds as a function of CF for sustained (black dots), onset (gray dots), and suppressed (asterisks) neurons. Bottom panel shows that overall, mean thresholds for both onset and sustained neurons increase with CF. E: Scatterplot (top) and mean ± SD (bottom) Q10 values showing a mild increase as a function of CF for each response type (Q10 values: sustained, 5 ± 3.6; onset, 3.7 ± 3.4; suppressed, 2.6 ± 1.3). C–E bottom, binwidth: 500 Hz.
