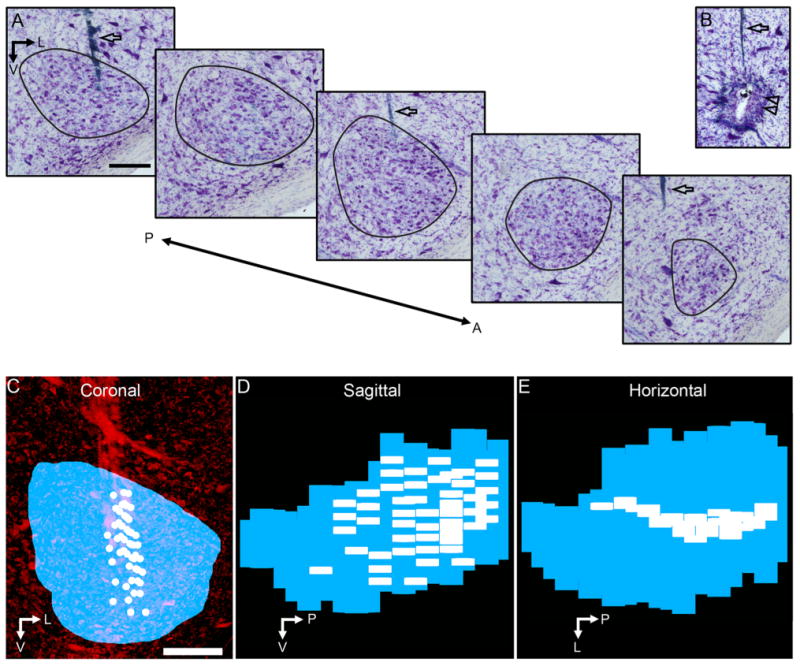
Figure 4.

3D reconstruction of the SON and locations of neuronal recordings. A: Series of Nissl-stained sections through the SON; black lines define SON borders. B: Electrolytic lesion site (double arrowheads) used to map recording sites to tissue. Open arrows (in A and B) indicate electrode tracks. C–E: 3D reconstruction of the SON (blue) and location of neuronal recordings (white) shown in coronal (C), sagittal (D), and horizontal (E) views. C shows the ventral brainstem stained for Nissl substance (red). Abbreviations: A, anterior; L, lateral; P, posterior; V, ventral. Scale bars = 200 μm in A (applies to A, B); in C (applies to C–E).
