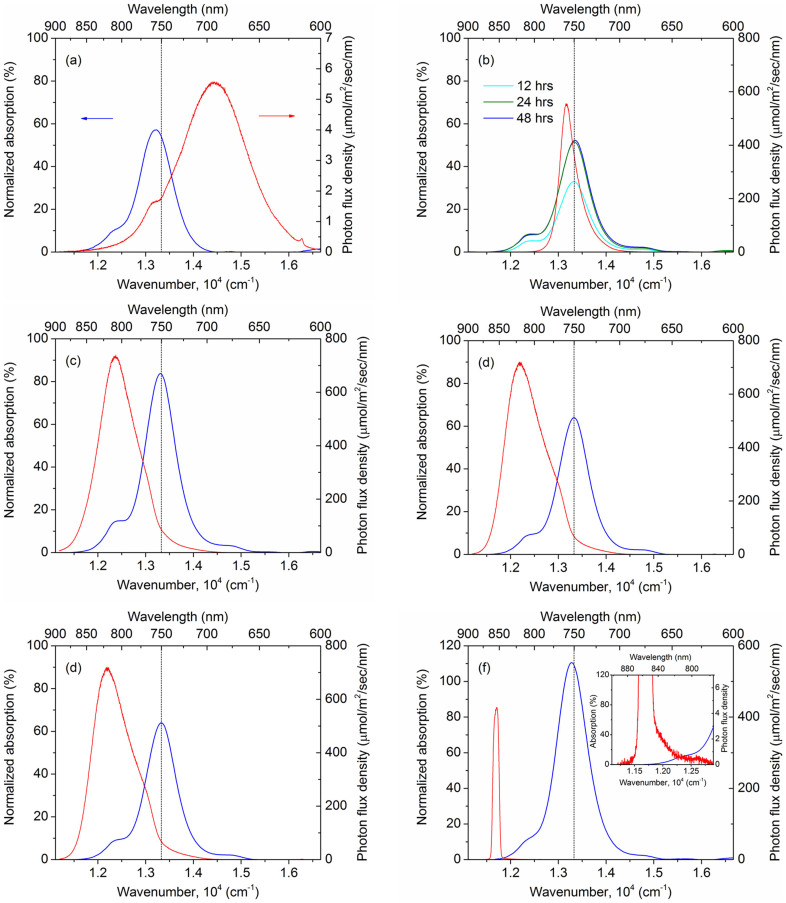
Figure 4. Absorption spectra of bacterial cultures grown with different LEDs, blue line, together with the emission spectra of LEDs, red line.
Panels (a)–(f) correspond to cultures grown with 700, 750, 780, 800, 850 nm LEDs and also 850 nm LEDs with a band-pass filter. The absorption spectra were taken after the peak intensity saturated, the baseline was removed and the peak intensity was normalized to the absorption at 625 nm. The photon flux density is calculated per 1 nm of the wavelength. The inset in panel (f) shows the overlap of the LED emission spectrum with the absorption peak. Additionally, panel (b) illustrates the time dynamics of the absorption peak.

