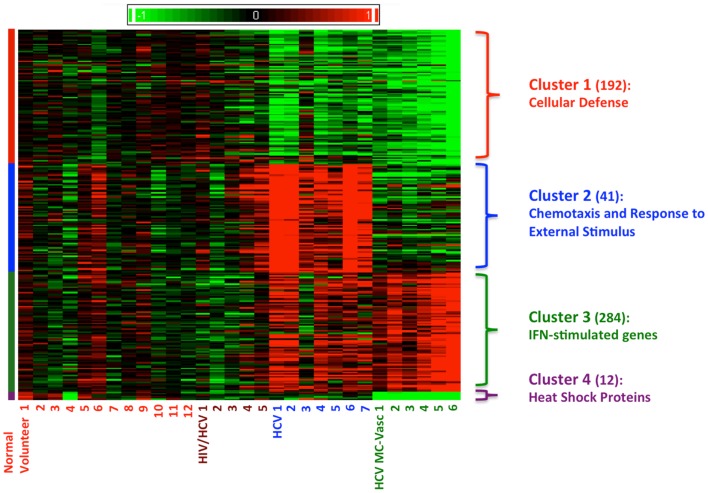
Figure 1.
Clustering of differentially expression genes in PBMCs from four patient cohorts. Levels of gene expression were assayed using Affymetrix Human Genome U133A chips as described in the methods section. A total of 529 differentially expressed genes were identified. Genes were grouped using K-means clustering, and samples were grouped by hierarchical clustering. Differences in relative levels of gene expression (Z-score) are represented by color, where red indicates up-regulation and green indicates down-regulation relative to that of corresponding gene expression in controls. The numbers in parentheses specify the number of genes in each cluster. Cluster 1 consists of genes down-regulated in HCV monoinfected patients and HCV MC vasculitis patients. Cluster 2 consists of genes up-regulated in HCV monoinfected patients without vasculitis. Cluster 3 consists of genes up-regulated in HCV MC vasculitis patients and Cluster 4 consists of genes down-regulated in HCV MC vasculitis patients.

