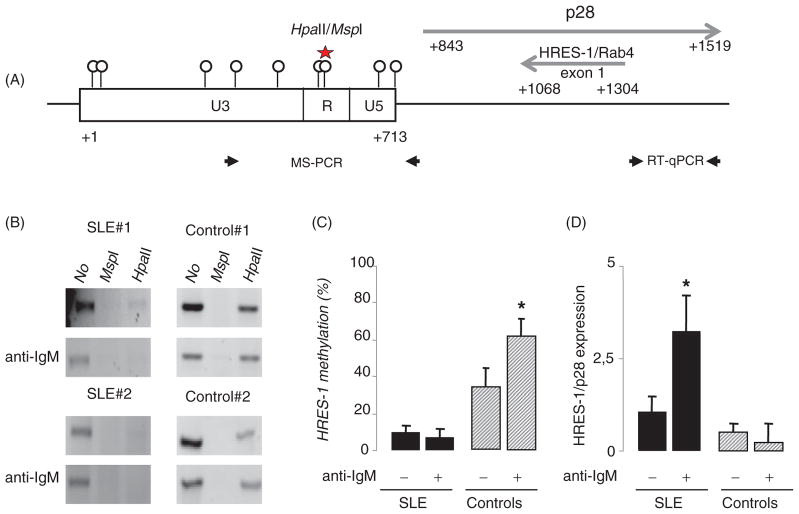
Figure 1.
The HRES-1 promoter region is demethylated in B cells from SLE patients and DNA demethylation modifies HRES-1/p28 expression. A: Schematic representation of the organization of HRES-1 on chromosome 1q42 region (GenBank X16660). Circles identify the 9 CpG motifs within the 5′ U3-R-U5 LTR region of HRES-1. Of note, the 3′ LTR region of HRES-1 is lacking. The HpaII/MspI motif present in the 5′U3-R-U5 LTR region is represented (star) as well as HRES-1/p28 and HRES-1/Rab4 transcript positions, and primers used in the MS-PCR and quantitative RT-PCR (RT-qPCR). B: Analysis of HRES-1 promoter methylation by amplification of genomic DNA digested with the methylation sensitive HpaII, or with the methylation insensitive MspI enzyme. The 502 bp HRES-1 amplicon contains one HpaII/MspI site. C: Histograms representing HRES-1 promoter methylation status in 6 SLE patients and 6 healthy controls, the percentage of methylation was quantified by calculating the ratio of HpaII-digested to undigested bands. D: Quantitative RT-PCR results presenting as histograms revealing that a 24-h stimulation of B cells with an anti-IgM increases HRES-1/p28 transcription in B cells from SLE patients, but not from healthy controls. The symbol * represented p<0.05.

