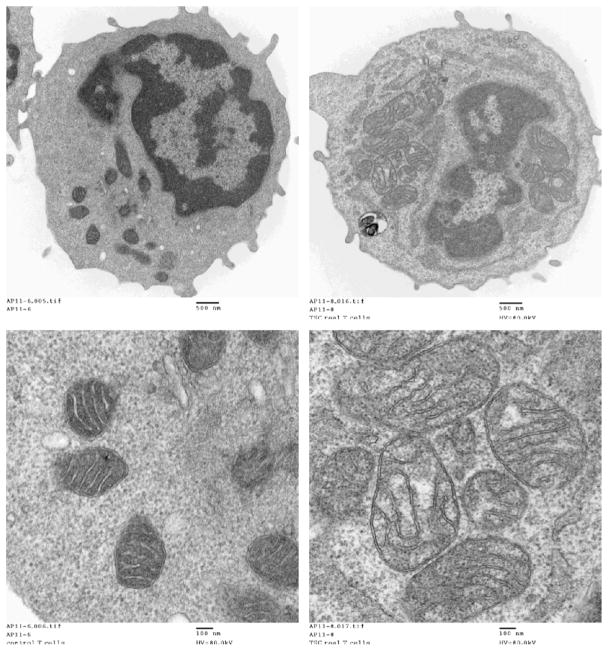
Figure 3.
The right panel shows increased size and numbers of mitochondria in T cells isolated from the patient with tuberous sclerosis overlapping with systemic lupus erythematosus (TSC/SLE). T cells were prepared by negative selection of peripheral blood mononuclear cells from a normal age-matched control are shown on the left; 5 × 10⁶ T cells were fixed in 2.5% glutaraldehyde and prepared for electron microscopy. Images shown represent 29,500× magnification of whole cells (top panels) and 108,000× magnification of mitochondria (bottom panels).

