
Fig. 2.
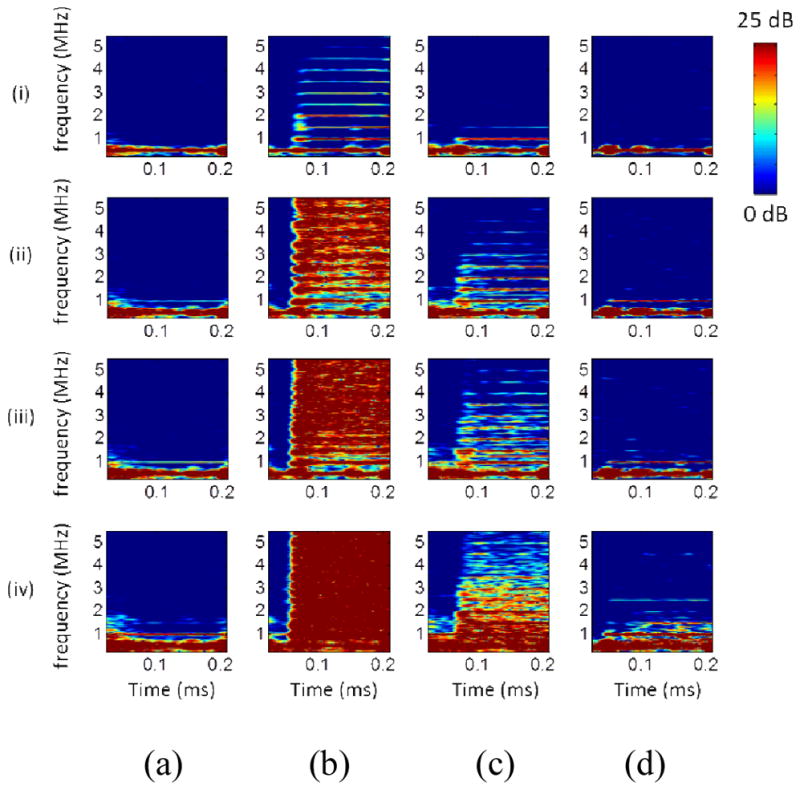
In vitro cavitation monitoring: spectrograms. (a) Sonicating water without the skull in place. (b) Sonicating microbubbles without the skull in place. (c) Sonicating microbubbles with the macaque skull in place. (d) Sonicating microbubbles with the human skull in place. (i), (ii), (iii), and (iv) represents 50 kPa, 150 kPa, 200 kPa, and 450 kPa, respectively. The colorbar shows the intensity of the spectra, with a dynamic range of 25 dB and 15 dB for the macaque and human skull experiments, respectively, based on the preamplification (macaque: 20 dB, human: 10 dB).