
Fig. 3.
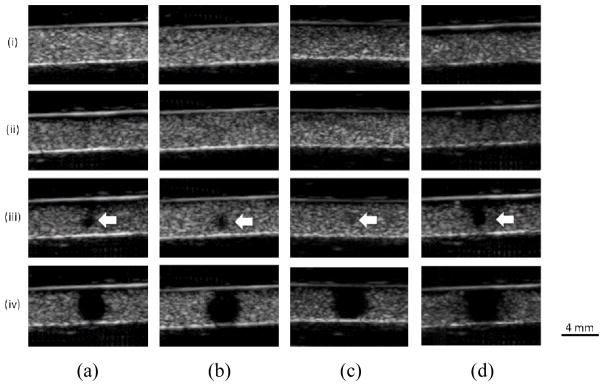
In vitro cavitation monitoring: B-mode images in transverse plane after the sonication. (a) Without the skull in place using 100 cycles. (b) With the macaque skull in place using 100 cycles. (c) With the human skull in place using 100 cycles. (d) Without the skull in place using 5000 cycles. (i), (ii), (iii), and (iv) represents 50 kPa, 150 kPa, 200 kPa, and 450 kPa, respectively. The arrows indicate the spot losing echogenicity at the pressure threshold (200 kPa). The images showed good focal alignment to the channel and the bubbles lost the property of contrast enhancement at or above 200 kPa. The shape to the hypoechogenitic area was roughly a circle with an averaged diameter of 1.3 mm at 200 kPa and 4 mm at 450 kPa.