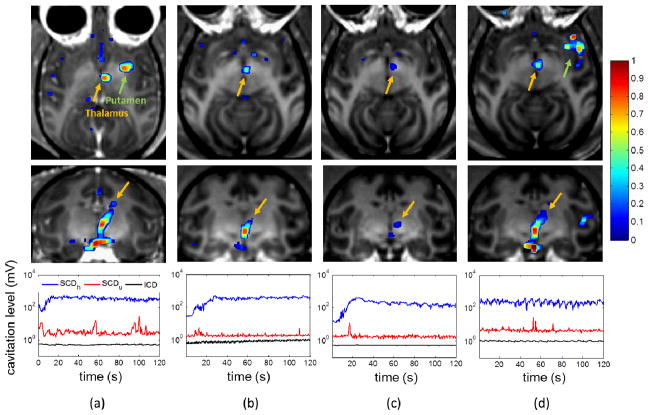
Fig. 8.
In vivo BBB opening at (a) 275 kPa, (b) 350 kPa, (c) 450 kPa, and (d) 600 kPa in the thalamus (orange arrow) or the putamen (green arrow). The upper and middle rows show the post-contrast T1 weighted images with calculated enhancement (with colorbar) in axial and coronal view, respectively. The opening volume of (a) to (d) was 494.7, 230.9, 112.9, and 299.2 mm3, respectively. The bottom row shows the real-time monitoring of the SCDh, SCDu, and ICD for sonicating the thalamus. Note that in (d) the microbubbles were injected before the sonication was started. Case (b)–(d) were performed in the same macaque.

