Figure 2.

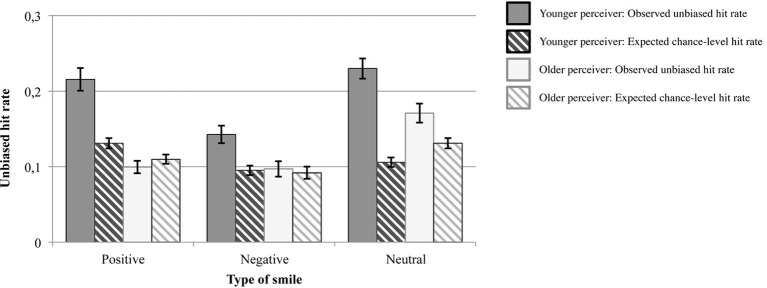
Observed unbiased hit rates and expected chance-level hit rates in Study 1. Error bars represent ±1 standard errors from the mean.

Observed unbiased hit rates and expected chance-level hit rates in Study 1. Error bars represent ±1 standard errors from the mean.