Figure 3.

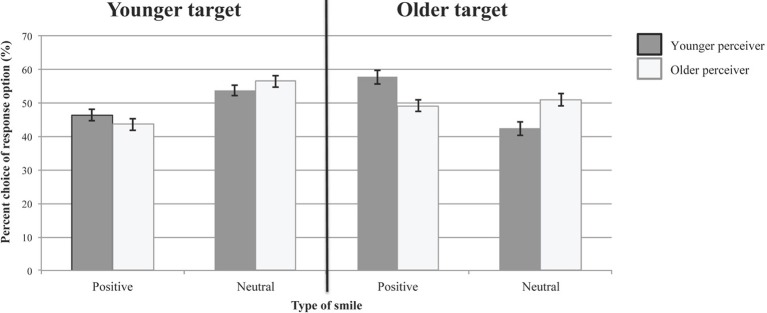
Use of response options in Study 2 (irrespective of whether response choice was correct). Error bars represent ±1 standard errors from the mean.

Use of response options in Study 2 (irrespective of whether response choice was correct). Error bars represent ±1 standard errors from the mean.