
Figure 8.
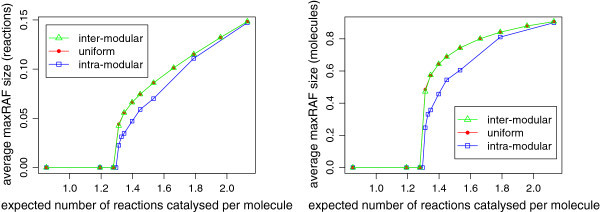
Size of the maxRAF in a partitioned system with n=15 . Plots showing how the average number of reactions and average number of molecules in the maxRAF change as the level of catalysis is increased, expressed as a proportion of the total number of reactions and molecules in the CRS when n=15. Instances containing no maxRAF were excluded from the calculation of the average.