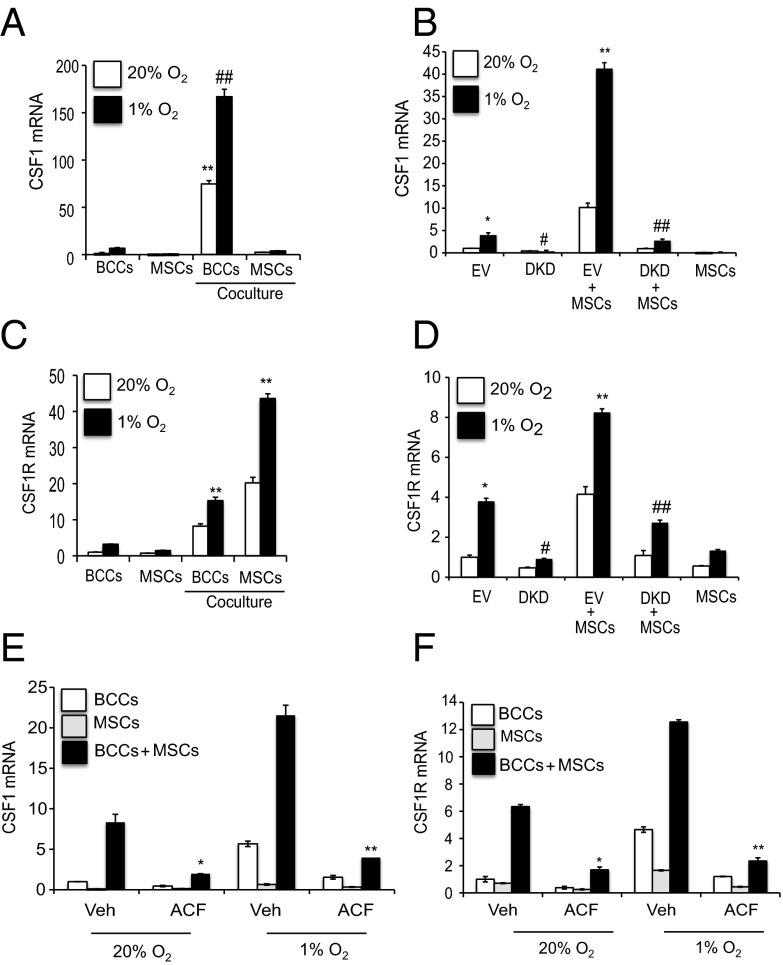
Fig. 4.
HIFs mediate coculture- and hypoxia-induced expression of CSF1 and CSF1R. (A and C) GFP-expressing MDA-MB-231 BCCs were cultured individually or cocultured with MSCs at 20% or 1% O2 for 48 h, and GFP+ BCCs and CD105+ MSCs were then sorted by FACS. CSF1 (A) and CSF1R (C) mRNA levels were determined and normalized to BCCs at 20% O2. **P < 0.001 vs. 20% BCCs; ##P < 0.001 vs. 1% BCCs. (B and D) EV BCCs, DKD BCCs, MSCs, EV + MSCs or DKD + MSCs were cultured at 20% or 1% O2 for 48 h. CSF1 (B) and CSF1R (D) mRNA levels were determined and normalized to EV at 20%. *P < 0.05 vs. 20% EV; **P < 0.001 vs. 1% EV; #P < 0.01 vs. 1% EV; ##P < 0.001 vs. 1% EV + MSCs. (E and F) BCCs, MSCs, or BCCs + MSCs were treated with 1 μM acriflavine (ACF) or DMSO vehicle (Veh) and exposed to 20% or 1% O2 for 48 h. CSF1 (E) and CSF1R (F) mRNA levels were normalized to BCC Veh at 20%. *P < 0.05 vs. Veh; **P < 0.001 vs. Veh.

