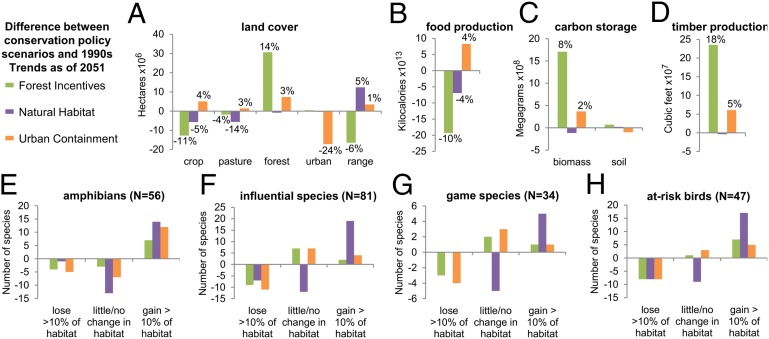
Fig. 4.
Projected changes under the three conservation policy scenarios (forest incentives, natural habitats, and urban containment) relative to projections based on the1990s Trends scenario for (A) land cover, (B) food production, (C) carbon storage, (D) timber production, and area of prime habitat for different groups of wildlife species (E–H). The bars in A–D display the difference between the policy scenarios and 1990s trends projection as of 2051, with labels for changes greater than 1%. Bars in E–H show the increase or decrease in the number of species in the categories (defined in Fig. 2) under each policy scenario compared with 1990s trends baseline scenario.

