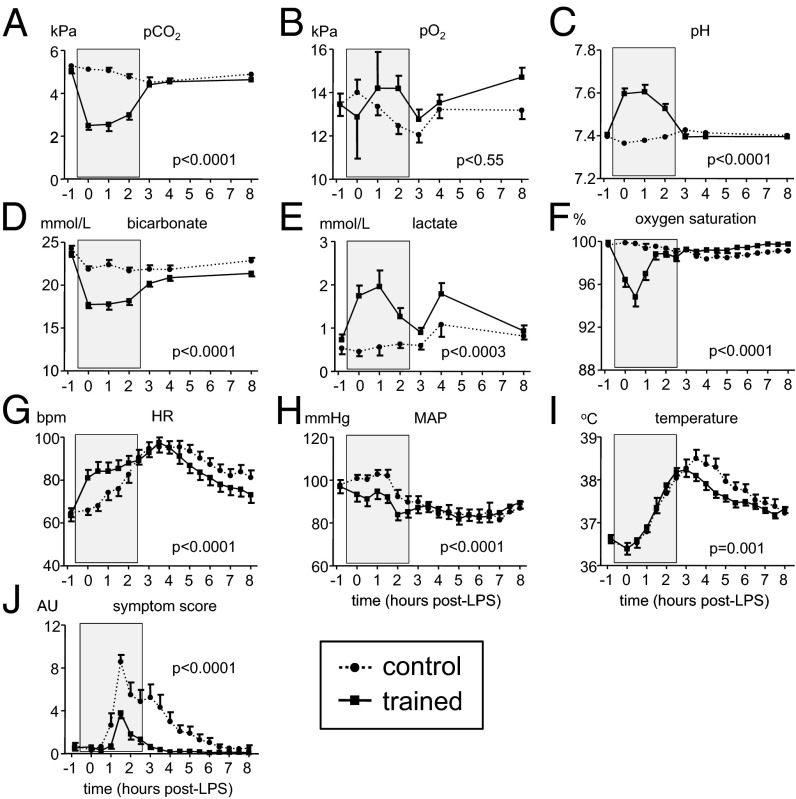
Fig. 1.
Cardiorespiratory parameters, temperature, and symptoms during experimental endotoxemia in control and trained subjects. (A) Carbon dioxide partial pressure (pCO2) in arterial blood. (B) Oxygen partial pressure (pO2) in arterial blood. (C) pH in arterial blood. (D) Bicarbonate (HCO3−) in arterial blood. (E) Lactate in arterial blood. (F) Oxygen saturation measured by pulse oximetry. (G) Heart rate (HR). (H) Mean arterial pressure (MAP). (I) Temperature. (J) Score of self-reported symptoms. Data are expressed as mean ± SEM of 12 subjects per group. Gray box indicates period in which the trained subjects practiced their learned breathing techniques. P values between groups were calculated using repeated measures two-way analysis of variance (ANOVA, interaction term). AU, arbitrary units; bpm, beats per minute.

