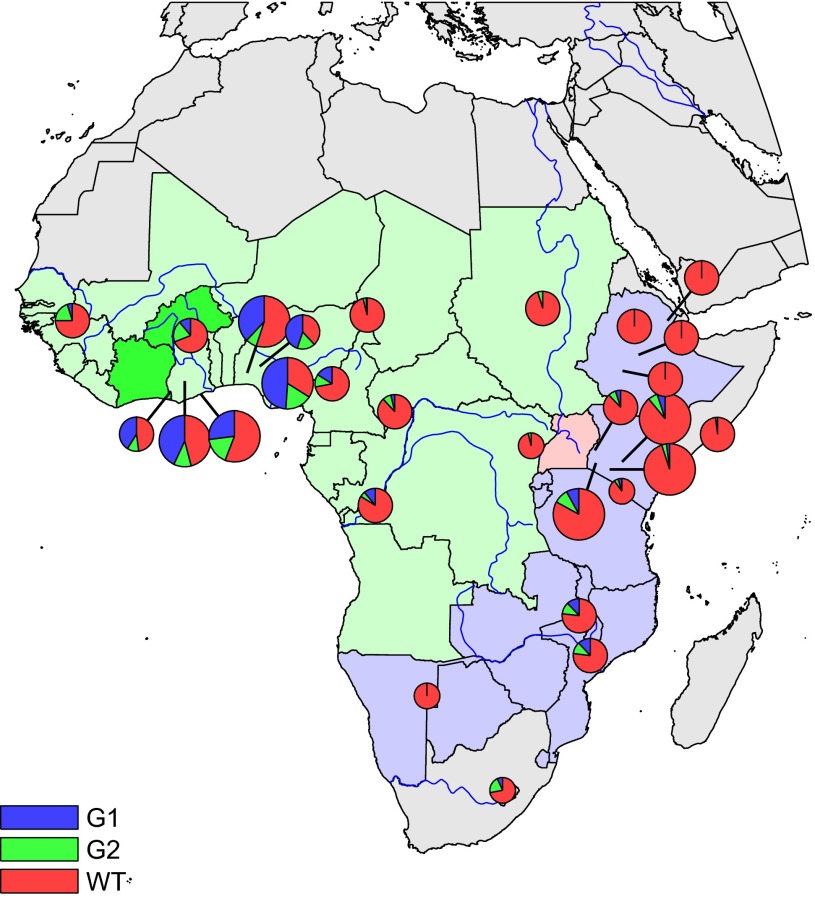
Fig. 1.
Distribution of the G1 and G2 APOL1 variants across Africa. Allele frequencies of the G1 and G2 variants are indicated as blue and green wedges, respectively. Circle size reflects the number of individuals genotyped: small, <10 individuals/20 chromosomes; medium, 10–100 individuals/20–200 chromosomes; large, >100 individuals/200 chromosomes. Countries are shaded according to the subspecies of Trypanosoma brucei that cause African sleeping sickness. Darker green, gambiense types 1 and 2; light green, gambiense type 1; pink, both rhodesiense and gambiense type 1; purple, rhodesiense.

