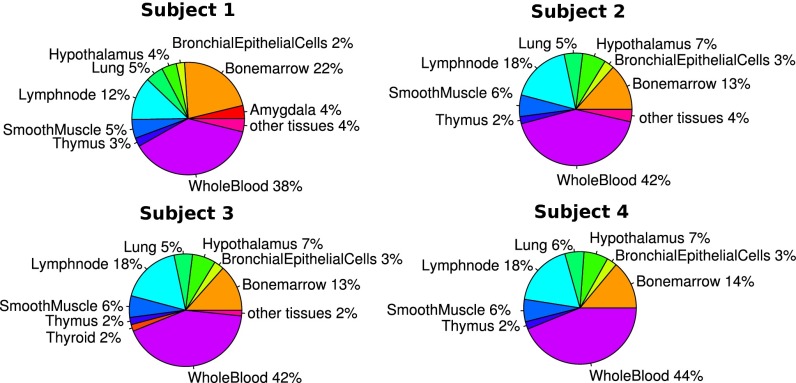
Fig. 1.
Using microarray expression data from the plasma of four normal controls, quadratic programming was performed using known tissue-specific expression from a publicly available database to obtain the relative tissue contribution of the respective different tissue types. The relative contribution from detected tissues were represented in pie charts for these four subjects. Distribution of contribution from different tissue types are fairly consistent between these subjects, with the major contributor of cell-free RNA originating from whole blood.

