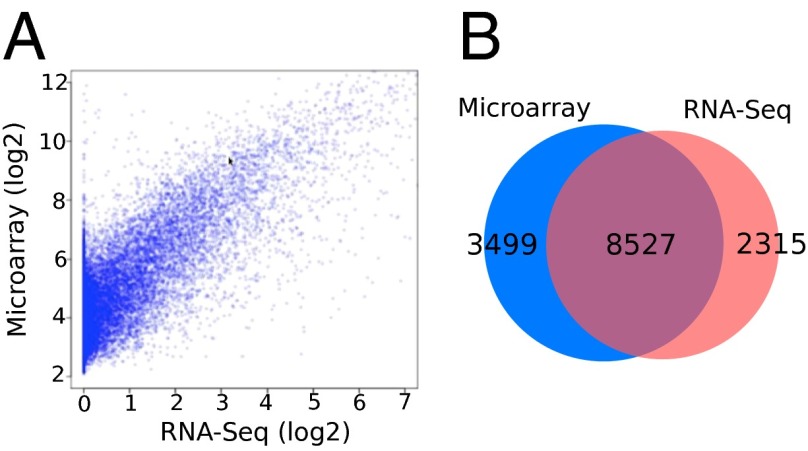
Fig. 2.
Characterization of maternal plasma transcriptome by RNA-seq and microarray assays. (A) The scatter plot of the correlation between RNA-seq and Affymetrix array assay for samples taken at the third trimester. The Pearson correlation coefficient is 0.78. (B) Venn diagram displaying the genes detected by RNA-seq and microarray. The cutoff for the RNA-Seq is fragments per kilobase of transcript per million mapped reads (FPKM) > 0. The cutoff for the microarray is intensity > 4. Sample P12_T3 is shown here as an example.

