
Fig. 2.
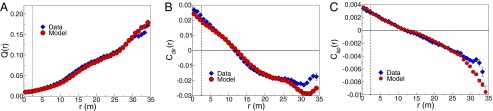
Correlation functions predicted by the maximum entropy model (red circles) vs. experiments (blue diamonds). (A) Similarity of velocities as a function of distance, defined in Eq. 12. The dashed vertical line indicates the size of the neighborhood defined by birds, within which we match the average Q exactly, by construction. (B) Correlations between fluctuations in flight direction as a function of distance, defined in Eq. 14. (C) Correlations between fluctuations in speed as a function of distance, defined in Eq. 15. All panels refer to the same flock and snapshot as in Fig. 1; theoretical predictions are from Eqs. S88–S91.