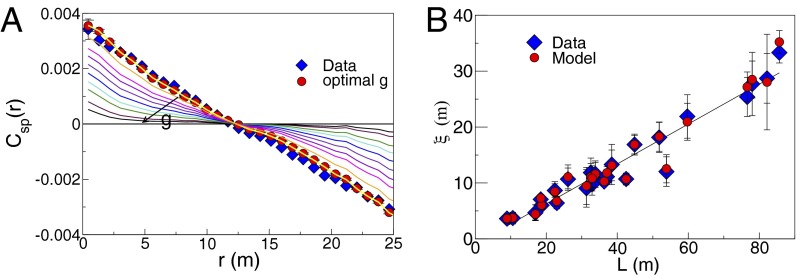
Fig. 3.
(A) Correlation function of the speed fluctuations for different values of the control parameter g (increasing in the direction of the arrow). All curves with g less than the optimal value collapse onto the yellow curve. (B) Correlation length, defined as the point where the correlation function crosses zero (6), in flocks of different sizes, for the experimental data (blue diamonds) and for the model (red circles).

