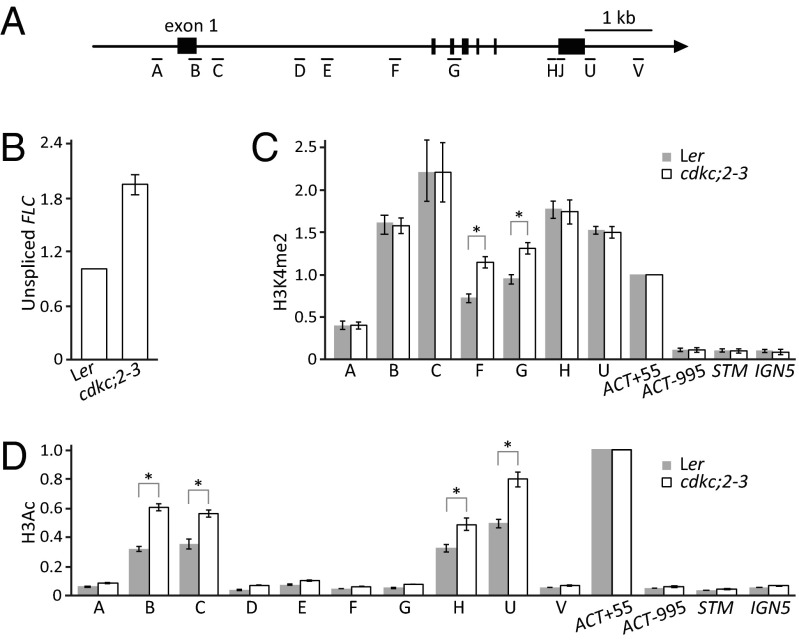
Fig. 3.
cdkc;2 increases FLC transcription. (A) Schematic of FLC. Vertical bars show the exons. A, B, C, D, E, F, G, H, U, and V show regions analyzed by qPCR in ChIP. (B) Unspliced FLC transcript analysis by qRT-PCR. (C) H3K4me2 ChIP assay in FLC regions in cdkc;2–3 and Ler. (D) H3Ac ChIP assay in FLC regions in cdkc;2–3 and Ler. (B–D) Values are means ± SEM from three biological repeats; data were presented as ratio of (modified histone level at FLC/H3 FLC) to (modified histone level at Actin/H3 Actin). Actin, STM, and IGN5 were used as internal controls for the ChIP experiments. *P < 0.05.

