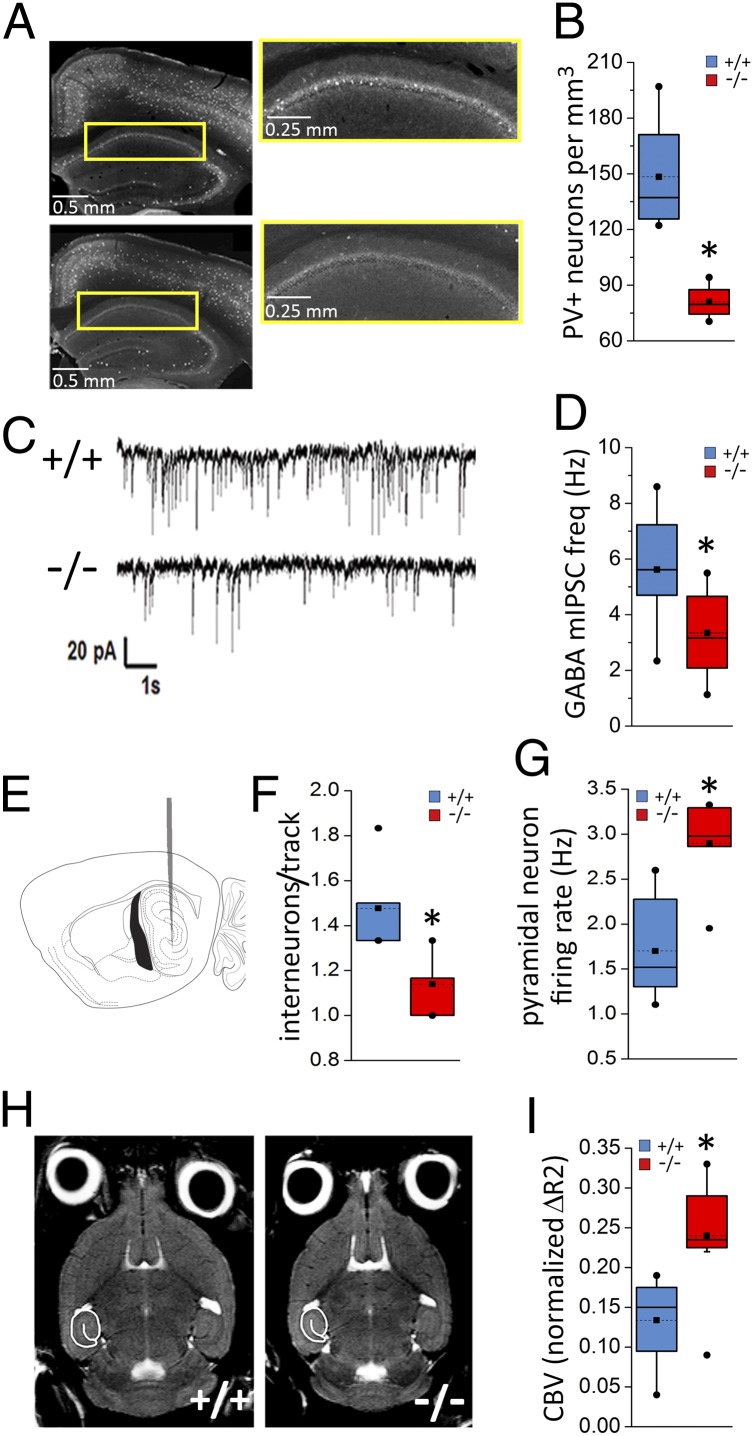
Fig. 1.
Impaired inhibition in the hippocampus of Ccnd2−/− mice. (A) Representative sections of the rostral hippocampus showing PV+ neuron distribution. Right shows higher-magnification of the CA1 region outlined in yellow on Left. (B) PV+ interneuron density in CA1 is reduced in Ccnd2−/− mice (t6 = 3.8, P < 0.05; n = 4). (C) Representative traces from whole-cell voltage-clamp recordings showing GABA-mediated mIPSCs in CA1 pyramidal neurons in Ccnd2+/+ (Upper) and Ccnd2−/− (Lower) mice. (D) mIPSC frequency in CA1 pyramidal cells is reduced in Ccnd2−/− mice (t19 = 2.7, P < 0.05; n = 9–12). (E) Schematic showing starting track for in vivo single-unit recordings in caudal hippocampus. (F) In vivo recording data showing fewer hippocampal units with spike characteristics of GABAergic (including PV+) interneurons in Ccnd2−/− mice (t11 = 3.9, P < 0.005; n = 6–7). (G) Increased in vivo spike activity (average firing rate) of hippocampal excitatory projection neurons in Ccnd2−/−mice (t11 = 4.1, P < 0.005). (H) MRI images of horizontal brain sections showing the hippocampal ROI. (I) Increased hippocampal CBV in Ccnd2 −/− mice (t14 = 3.3, P < 0.01; n = 8). Box plots show interquartile range; whiskers extend to the outermost data points within 1.5x of the interquartile range. Means are marked by dotted lines and squares, medians by solid lines, and outliers by solid circles. *P < 0.05, independent t tests.

