
Fig. 3.
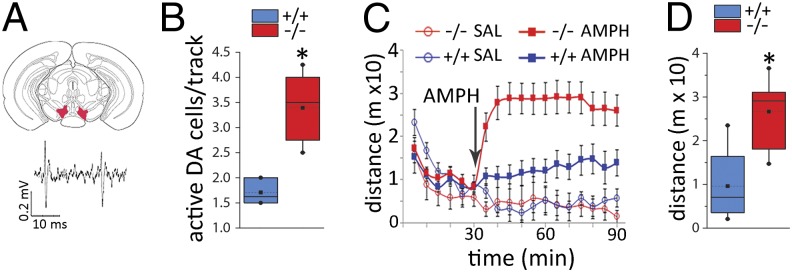
Increased VTA dopamine neuron population activity and hyperresponsiveness to AMPH in Ccnd2−/− mice. (A) Schematic of coronal section through the VTA recording region (Upper) and representative extracellular trace of VTA DA neuron spiking patterns in vivo (Lower) (see also Fig. S6). (B) The number of spontaneously active DA cells is increased in Ccnd2−/− mice (t8.8 = 6.3, P < 0.01; n = 6–7). (C) Locomotor activity before and after injection of saline or AMPH (2.0 mg/kg, i.p.) (n = 4 and 13 per genotype for saline and AMPH, respectively; arrow indicates time of injection). The pattern shows an interaction between genotype and dose (F1,29 = 6.0, P < 0.05), genotype and time (F1,29 = 11.2, P < 0.01), and a trend for a three-way interaction (P = 0.078) (n = 4 per genotype for saline; 10–14 per genotype for AMPH). Planned comparisons show no differences between genotypes before injection (t31 = 0.2, P > 0.25) or following saline (t6 = 0.13, P > 0.25, drug groups combined). (D) Average post-AMPH locomotion is increased in Ccnd2−/− mice (t23 = 4.5, P < 0.001). Box plot parameters are described in Fig. 1. *P < 0.05, independent t tests.