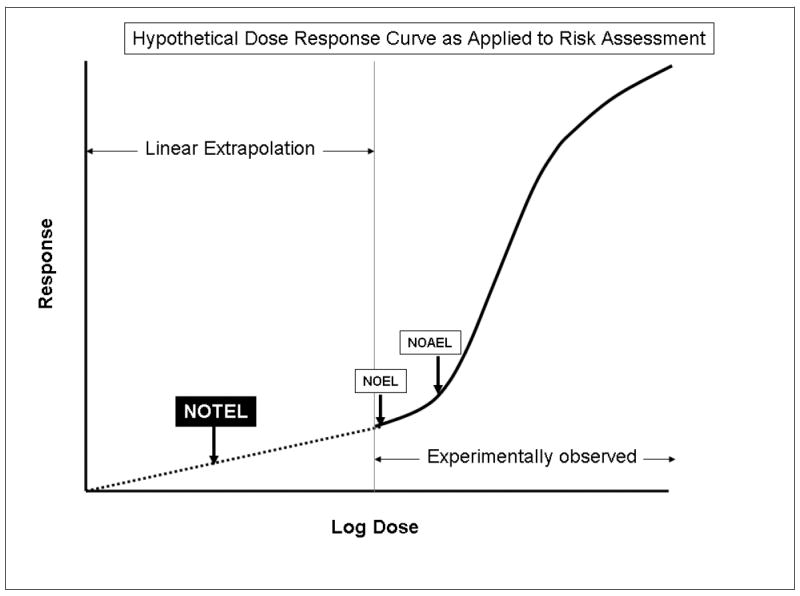
Figure 1. Hypothetical Dose Response Curve as Applied to Risk Assessment.

The solid line indicates a typical response curve that shows a threshold for the experimentally measured endpoint. These data are then used to determine a NOEL and/or a NOAEL. Data can also be used for modeling to estimate a benchmark dose. Default safety factors are then used to determine a reference dose. In the case of genotoxic or carcinogenic compounds, linear dose extrapolation is used to set an acceptable risk level. The use of genomics provides the opportunity to define much more sensitive NOTEL (indicated on graph), NOAEL or a mechanistically based benchmark dose (the latter two not indicated) for use in risk assessment.
