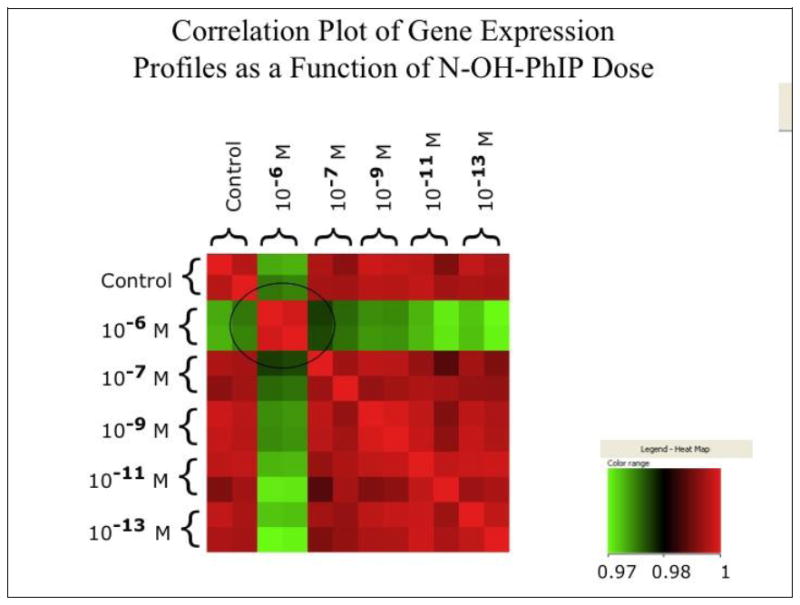
Figure 2. Correlation Plot of Gene Expression Profiles as a Function of N-OH-PhIP Dose.

Gene expression analyses were performed in duplicate at the indicated doses of N-hydroxy-PhIP using Affymetrix GeneChip Human Genome U133 Plus™ arrays. After normalization and background subtraction, the similarity in gene expression patterns between all samples was evaluated pair-wise using the Array Assist software package. The heat map in the legend indicates the relationship between color and the correlation coefficient across all genes of a given pair of arrays. Circle highlights a region which illustrates that a dose of 10-6 yields a pattern of gene expression that is substantially different from controls and lower doses.
