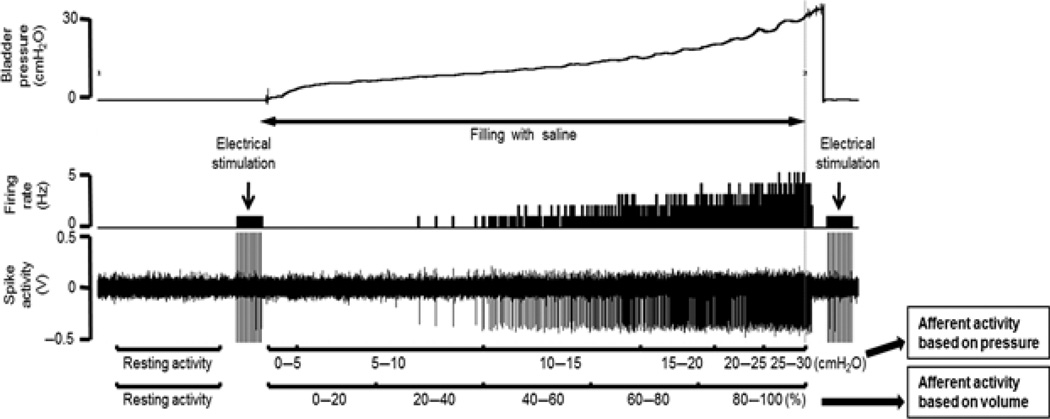
Figure 3.
Typical single afferent activity traces. Recorded afferent activity was averaged at 5-cm H2O interval of pressure or at five equal divisions (0–20, 20–40, 40–60, 60–80 and 80–100%) of volume in the filling phase. Average total unitary activity was also calculated in function of intravesical pressure or volume. Afferent nerve activity is expressed as impulses per second or Hz, which is based on pressure or volume respectively (Aizawa, Wyndaele University Antwerp 2011).

