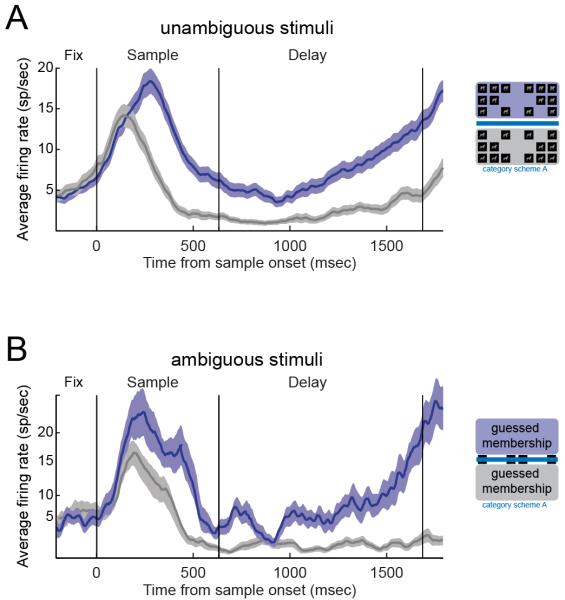
Figure 4.
Category and guessing sensitivity of an example PFC neuron. (A) This neuron preferred category scheme A with its average activity (mean+/−SEM) in response to images of category 1 (purple line) was greater than its response for category 2 (gray line) in the sample presentation interval and throughout the memory delay. (B) The neuron showed the same category sensitivity for ambiguous stimuli, with an increased activity when the monkey guessed the image to be category 1 (purple line) as opposed to category 2 (gray line).

